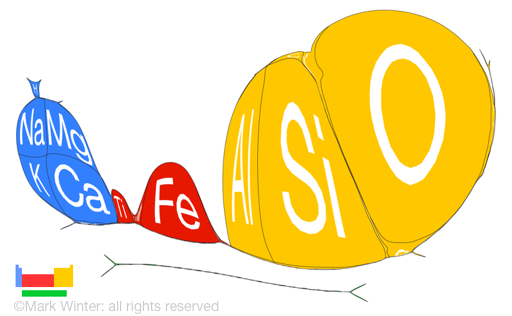
Iron - 26Fe: geological information
Iron is not found as the free metal in nature. The most common ore is haematite (iron oxide, Fe203). Iron is found in other minerals such as magnetite, which is seen as black sands along beaches. The core of the earth, more than 2000 in radius, is composed largely of iron. The metal is the fourth most abundant element by weight in the earth's crust.
Iron is found native in meteorites known as siderites.
Abundances of iron in various environments
In this table of abundances, values are given in units of ppb (parts per billion; 1 billion = 109), both in terms of weight and in terms of numbers of atoms. Values for abundances are difficult to determine with certainty, so all values should be treated with some caution, especially so for the less common elements. Local concentrations of any element can vary from those given here an orders of magnitude or so and values in various literature sources for less common elements do seem to vary considerably.
| Location | ppb by weight | ppb by atoms |
|---|---|---|
| Universe | 1100000 | 20000 |
| Sun | 1000000 | 30000 |
| Meteorite (carbonaceous) | 220000000 | 77000000 |
| Crustal rocks | 63000000 | 23000000 |
| Sea water | 3 | 0.33 |
| Stream | 670 | 12 |
| Human | 60000 | 6700 |


The chart above shows the log of the abundance (on a parts per billion scale) of the elements by atom number in our sun. Notice the "sawtooth" effect where elements with even atomic numbers tend to be more strongly represented than those with odd atomic numbers. This shows up best using the "Bar chart" option on the chart.